Basisstatistiken
| Institutionelle Aktien (Long) | 48.085.502 - 63,10% (ex 13D/G) - change of -1,00MM shares -1,99% MRQ |
| Institutioneller Wert (Long) | $ 1.916.177 USD ($1000) |
Institutioneller Eigentümerschaft und Aktionäre
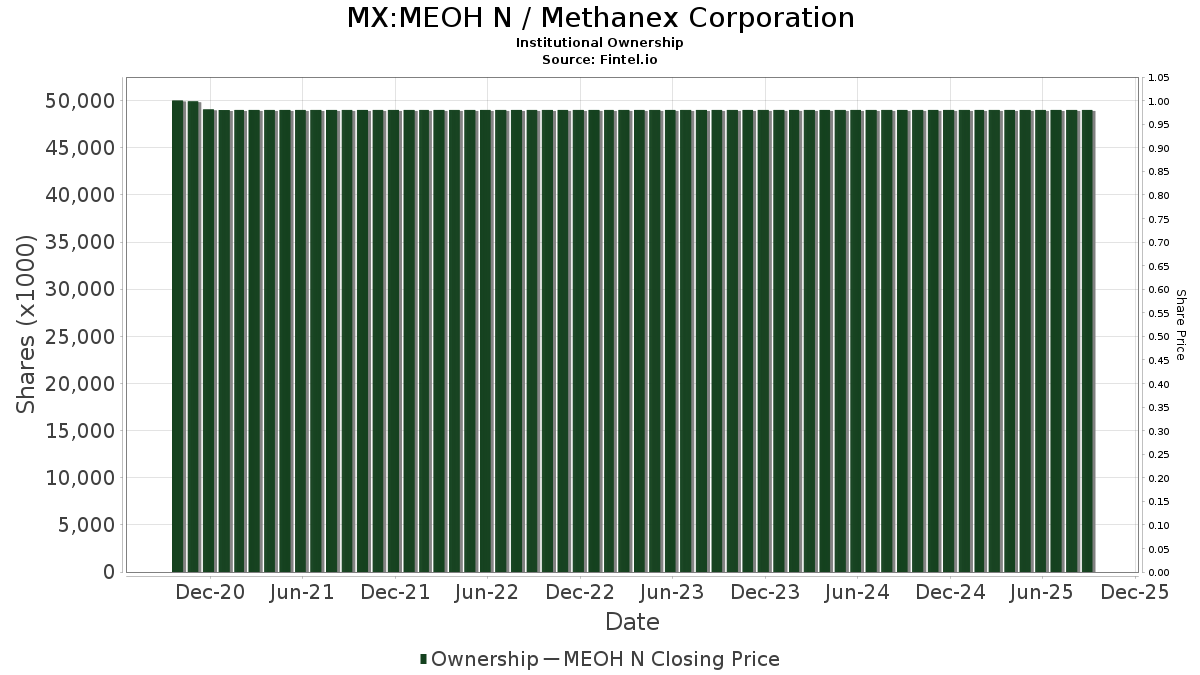
Methanex Corporation (MX:MEOH N) hat 185 institutionelle Eigentümer und Aktionäre, die 13D/G oder 13F Formulare bei der Securities Exchange Commission (SEC) eingereicht haben. Diese Institutionen halten insgesamt 48,085,502 Aktien. Die größten Aktionäre sind M&G Plc, Vanguard Group Inc, Wellington Management Group Llp, Fmr Llc, Dixon Mitchell Investment Counsel Inc., FIL Ltd, Connor, Clark & Lunn Investment Management Ltd., Mackenzie Financial Corp, Royal Bank Of Canada, and Bank Of Montreal /can/ .
Methanex Corporation (BMV:MEOH N) Die institutionelle Eigentümerstruktur zeigt die aktuellen Positionen von Institutionen und Fonds im Unternehmen sowie die jüngsten Veränderungen der Positionsgröße. Zu den Großaktionären können Einzelanleger, Investmentfonds, Hedgefonds oder Institutionen gehören. Der Schedule 13D zeigt an, dass der Investor mehr als 5% des Unternehmens hält (oder gehalten hat) und beabsichtigt (oder beabsichtigt hat), aktiv eine Änderung der Geschäftsstrategie zu verfolgen. Schedule 13G zeigt eine passive Investition von über 5% an.
Fondsstimmung-Score
Der Fondsstimmung-Score (auch bekannt als Eigentümer-Akkumulations-Score) ermittelt die Aktien, die am meisten von Fonds gekauft werden. Er ist das Ergebnis eines ausgeklügelten quantitativen Multifaktormodells, das die Unternehmen mit den höchsten institutionellen Käufen identifiziert. Das Scoring-Modell verwendet eine Kombination aus der Gesamtzunahme der offengelegten Eigentümer, den Änderungen der Portfolioallokationen in diesen Eigentümern und anderen Metriken. Die Zahl reicht von 0 bis 100, wobei höhere Zahlen ein höheres Maß an Kapitalakkumulation als bei anderen Unternehmen anzeigen und 50 den Durchschnitt darstellt.
Aktualisierungshäufigkeit: Täglich
Siehe Ownership Explorer, der eine Liste der am höchsten bewerteten Unternehmen enthält.
AI+ Ask Fintel’s AI assistant about Methanex Corporation.
Select a question to share a public post with an AI-crafted answer.
Thinking of good questions…
13F und NPORT Einreichungen
Details zu 13F-Einreichungen sind kostenlos. Für Details zu NP-Einreichungen ist eine Premium-Mitgliedschaft erforderlich. Grüne Zeilen zeigen neue Positionen an. Rote Zeilen zeigen geschlossene Positionen an. Klicken Sie auf das Link Symbol, um den gesamten Transaktionsverlauf zu sehen.
Upgrade
um Prämiendaten freizuschalten und nach Excel zu exportieren ![]() .
.
| Datei Datum | Quelle | Anleger | Typ | Durchschnittlicher Preis (Est) |
Aktien | Δ Aktien (%) |
Gemeldeter Wert ($1000) |
Δ Wert (%) |
Port Alloc (%) |
|
|---|---|---|---|---|---|---|---|---|---|---|
| 2025-11-14 | 13F | Twinbeech Capital Lp | 0 | -100,00 | 0 | |||||
| 2026-02-10 | 13F | Connor, Clark & Lunn Investment Management Ltd. | 1.750.281 | 22,19 | 69.424 | 21,93 | ||||
| 2026-02-04 | 13F | LRI Investments, LLC | 55 | 0,00 | 2 | 0,00 | ||||
| 2026-02-13 | 13F | Macquarie Group Ltd | 0 | -100,00 | 0 | |||||
| 2025-11-14 | 13F | Numerai GP LLC | 0 | -100,00 | 0 | |||||
| 2026-02-17 | 13F | Advisor Group Holdings, Inc. | 735 | -29,73 | 29 | -29,27 | ||||
| 2025-11-14 | 13F | Lighthouse Investment Partners, LLC | 0 | -100,00 | 0 | |||||
| 2026-01-23 | 13F | Ritholtz Wealth Management | 9.438 | 375 | ||||||
| 2026-02-09 | 13F | Hartland & Co., LLC | 1.784 | 336,19 | 71 | 337,50 | ||||
| 2026-02-17 | 13F | Hartree Partners, LP | 0 | -100,00 | 0 | |||||
| 2026-02-18 | 13F/A | Alberta Investment Management Corp | 1.111.000 | 12,00 | 44.129 | 11,88 | ||||
| 2026-02-13 | 13F | Cornerstone Financial Management LLC | 13 | 1 | ||||||
| 2026-02-17 | 13F | Man Group plc | 388.216 | -23,47 | 15.420 | -23,55 | ||||
| 2026-02-17 | 13F | Northern Trust Corp | 137.105 | -12,85 | 5.446 | -12,94 | ||||
| 2026-02-11 | 13F | Cerity Partners LLC | 14.425 | -0,37 | 573 | -0,52 | ||||
| 2026-02-17 | 13F | Delaware Management Holdings, Inc. | 178.659 | 7.097 | ||||||
| 2025-11-06 | 13F | MQS Management LLC | 0 | -100,00 | 0 | -100,00 | ||||
| 2026-02-06 | 13F | EverSource Wealth Advisors, LLC | 170 | -31,17 | 7 | -33,33 | ||||
| 2026-02-12 | 13F | Bank Of Nova Scotia Trust Co | 13.212 | 525 | ||||||
| 2026-02-10 | 13F | Hillsdale Investment Management Inc. | 151.560 | -16,50 | 6.022 | -16,52 | ||||
| 2025-11-13 | 13F | Acadian Asset Management Llc | 0 | -100,00 | 0 | |||||
| 2025-11-12 | 13F | Fox Run Management, L.l.c. | 0 | -100,00 | 0 | |||||
| 2026-02-13 | 13F | Peak6 Llc | Call | 165.500 | -17,17 | 6.574 | -17,26 | |||
| 2026-02-17 | 13F | Westwood Holdings Group Inc | 17.115 | 0,00 | 680 | -0,15 | ||||
| 2026-02-11 | 13F | CenterBook Partners LP | 45.568 | 1.810 | ||||||
| 2026-02-11 | 13F | Vise Technologies, Inc. | 6.223 | 247 | ||||||
| 2026-01-20 | 13F | Signaturefd, Llc | 3.404 | 0,06 | 135 | 0,00 | ||||
| 2026-02-17 | 13F | SIG North Trading, ULC | Put | 30.600 | -7,83 | 1.215 | -7,95 | |||
| 2026-02-17 | 13F | SIG North Trading, ULC | Call | 55.800 | 97,87 | 2.216 | 97,68 | |||
| 2025-11-07 | 13F | Shell Asset Management Co | 800 | -77,96 | 0 | |||||
| 2026-02-17 | 13F | SIG North Trading, ULC | 5.662 | 225 | ||||||
| 2026-02-05 | 13F | Pinnacle Associates Ltd | 17.669 | -4,33 | 702 | -4,50 | ||||
| 2025-11-21 | 13F | Nebula Research & Development LLC | 0 | -100,00 | 0 | |||||
| 2025-11-14 | 13F | Point72 Asia (Singapore) Pte. Ltd. | 4.129 | 164 | ||||||
| 2026-02-13 | 13F | Squarepoint Ops LLC | 0 | -100,00 | 0 | -100,00 | ||||
| 2026-02-10 | 13F | Td Asset Management Inc | 932.123 | 35,20 | 37.020 | 35,03 | ||||
| 2026-01-30 | 13F | Mitsubishi UFJ Trust & Banking Corp | 7.800 | 44,44 | 306 | 42,52 | ||||
| 2026-02-17 | 13F | Wellington Management Group Llp | 2.316.270 | 629,52 | 92.000 | 628,71 | ||||
| 2026-02-11 | 13F | Simplex Trading, Llc | Put | 2.400 | -88,24 | 95 | ||||
| 2026-02-17 | 13F | Royal Bank Of Canada | Call | 0 | -100,00 | 0 | ||||
| 2026-02-12 | 13F | Renaissance Technologies Llc | 120.678 | -22,26 | 4.793 | -22,33 | ||||
| 2026-01-07 | 13F | CWA Asset Management Group, LLC | 29.935 | 5,21 | 1.189 | 5,13 | ||||
| 2026-02-17 | 13F | Point72 Asset Management, L.P. | 290.812 | -0,04 | 11.553 | -0,11 | ||||
| 2025-11-12 | 13F | Quantbot Technologies LP | 0 | -100,00 | 0 | |||||
| 2026-01-09 | 13F | Pacifica Partners Inc. | 350 | 0,00 | 14 | 7,69 | ||||
| 2026-02-13 | 13F | Parkside Financial Bank & Trust | 2.143 | 61,01 | 85 | 63,46 | ||||
| 2026-02-13 | 13F | Dixon Mitchell Investment Counsel Inc. | 2.048.214 | 0,38 | 81.363 | 0,12 | ||||
| 2026-02-12 | 13F | Jane Street Group, Llc | Put | 0 | -100,00 | 0 | -100,00 | |||
| 2026-02-24 | 13F | Bell Investment Advisors, Inc | 0 | -100,00 | 0 | |||||
| 2026-02-13 | 13F | Walleye Capital LLC | 1.505 | 0,87 | 60 | 0,00 | ||||
| 2026-02-13 | 13F | Pinnacle Wealth Planning Services, Inc. | 582 | 23 | ||||||
| 2026-02-13 | 13F | Walleye Capital LLC | Put | 4.200 | -10,64 | 167 | -10,75 | |||
| 2025-11-14 | 13F | AYAL Capital Advisors Ltd | Put | 0 | -100,00 | 0 | -100,00 | |||
| 2025-11-14 | 13F | AYAL Capital Advisors Ltd | 0 | -100,00 | 0 | -100,00 | ||||
| 2026-01-27 | 13F | WealthCollab, LLC | 109 | 0,00 | 4 | 0,00 | ||||
| 2026-02-13 | 13F | BNP Paribas Asset Management Holding S.A. | 13.567 | 1 | ||||||
| 2026-02-13 | 13F | Caitong International Asset Management Co., Ltd | 103 | 4 | ||||||
| 2026-02-12 | 13F | Granite Investment Partners, LLC | 314.250 | -6,27 | 12.482 | -6,36 | ||||
| 2026-02-12 | 13F | Jane Street Group, Llc | Call | 21.500 | -65,21 | 854 | -65,28 | |||
| 2026-02-13 | 13F | Rhumbline Advisers | 2.366 | -12,98 | 94 | -13,89 | ||||
| 2025-11-14 | 13F | Lombard Odier Asset Management (USA) Corp | Call | 0 | -100,00 | 0 | -100,00 | |||
| 2026-02-11 | 13F | Parallel Advisors, LLC | 2.325 | 2,15 | 92 | 2,22 | ||||
| 2026-02-12 | 13F | CIBC Private Wealth Group, LLC | 33 | 1 | ||||||
| 2026-02-13 | 13F | Y-Intercept (Hong Kong) Ltd | 0 | -100,00 | 0 | |||||
| 2026-02-10 | 13F | JTC Employer Solutions Trusteee Ltd | 3.250 | 0,00 | 0 | |||||
| 2025-11-14 | 13F | Wetherby Asset Management Inc | 6.849 | -5,69 | 272 | 13,33 | ||||
| 2026-02-13 | 13F | Verition Fund Management LLC | 17.935 | 712 | ||||||
| 2026-02-12 | 13F | Qtron Investments LLC | 8.360 | 332 | ||||||
| 2026-02-17 | 13F | Graham Capital Management, L.P. | 9.904 | -65,23 | 393 | -65,28 | ||||
| 2026-01-27 | 13F | Zurcher Kantonalbank (Zurich Cantonalbank) | 20.275 | 805 | ||||||
| 2026-02-17 | 13F | Amundi | 66.919 | 11,95 | 2.658 | 12,20 | ||||
| 2025-11-13 | 13F | Hsbc Holdings Plc | 0 | -100,00 | 0 | -100,00 | ||||
| 2026-02-06 | 13F | Pnc Financial Services Group, Inc. | 2.106 | -15,15 | 84 | -15,31 | ||||
| 2026-02-13 | 13F | Smartleaf Asset Management LLC | 502 | 182,02 | 20 | 185,71 | ||||
| 2026-02-13 | 13F | American Century Companies Inc | 236.722 | 544,07 | 9.389 | 542,64 | ||||
| 2025-11-14 | 13F | Walnut Level Capital LLC | Call | 0 | -100,00 | 0 | -100,00 | |||
| 2026-02-11 | 13F | O'shaughnessy Asset Management, Llc | 23.905 | 80,37 | 949 | 80,42 | ||||
| 2026-02-18 | 13F | Mackenzie Financial Corp | 1.503.341 | -2,07 | 60.445 | -0,95 | ||||
| 2026-02-11 | 13F | Jpmorgan Chase & Co | 77.963 | -71,06 | 3.097 | -71,09 | ||||
| 2026-02-13 | 13F | Chou Associates Management Inc. | 20.000 | 0,00 | 793 | -0,25 | ||||
| 2026-02-17 | 13F | Two Sigma Investments, Lp | 196.567 | -11,48 | 7.808 | -11,58 | ||||
| 2026-02-11 | 13F | Deutsche Bank Ag\ | 4.622 | 0,00 | 184 | 0,00 | ||||
| 2026-02-11 | 13F | Simplex Trading, Llc | 4.011 | -89,81 | 159 | 15.800,00 | ||||
| 2026-02-11 | 13F | Simplex Trading, Llc | Call | 1.800 | -86,05 | 71 | ||||
| 2026-02-17 | 13F | D. E. Shaw & Co., Inc. | Put | 108.000 | -20,30 | 4.285 | -20,45 | |||
| 2026-02-17 | 13F | D. E. Shaw & Co., Inc. | 483.657 | -15,67 | 19.202 | -15,78 | ||||
| 2025-11-14 | 13F | Wolverine Trading, Llc | 15.656 | -18,75 | 625 | -41,37 | ||||
| 2026-02-17 | 13F | D. E. Shaw & Co., Inc. | Call | 9.700 | 0,00 | 385 | -0,26 | |||
| 2025-11-14 | 13F | Hrt Financial Lp | 0 | -100,00 | 0 | |||||
| 2026-02-12 | 13F | Swiss National Bank | 107.300 | 1,42 | 4.265 | 1,33 | ||||
| 2026-02-17 | 13F | Advisory Services Network, LLC | 0 | -100,00 | 0 | |||||
| 2026-02-13 | 13F | Aviso Financial Inc. | 0 | -100,00 | 0 | |||||
| 2025-11-14 | 13F | Encompass Capital Advisors LLC | 0 | -100,00 | 0 | |||||
| 2025-11-14 | 13F | Scientech Research LLC | 0 | -100,00 | 0 | |||||
| 2025-11-14 | 13F | Oxford Asset Management Llp | 12.936 | -23,91 | 514 | -8,54 | ||||
| 2026-02-02 | 13F | Fifth Third Bancorp | 322 | 0,00 | 13 | 0,00 | ||||
| 2025-11-14 | 13F | Symmetry Investments LP | Put | 0 | -100,00 | 0 | -100,00 | |||
| 2025-11-14 | 13F | Prelude Capital Management, Llc | 0 | -100,00 | 0 | |||||
| 2026-02-17 | 13F | Walnut Level Capital LLC | 402.532 | 1,39 | 15.989 | 1,29 | ||||
| 2026-02-11 | 13F | DCF Advisers, LLC | 5.500 | 218 | ||||||
| 2026-02-13 | 13F | Entropy Technologies, LP | 8.663 | -8,46 | 344 | -8,51 | ||||
| 2026-02-10 | 13F | Envestnet Asset Management Inc | 21.611 | -45,41 | 858 | -45,49 | ||||
| 2026-02-13 | 13F | JustInvest LLC | 5.505 | 1,98 | 219 | 1,87 | ||||
| 2025-09-29 | NP | CVY - Invesco Zacks Multi-Asset Income ETF This fund is a listed as child fund of Invesco Ltd. and if that institution has disclosed ownership in this security, then these positions will not be double counted when calculating total shares and total value | 10.763 | -48,34 | 360 | -54,56 | ||||
| 2026-02-17 | 13F | Alliancebernstein L.p. | 600.075 | -3,39 | 23.835 | -3,49 | ||||
| 2026-02-05 | 13F | Allworth Financial LP | 49 | 157,89 | 2 | |||||
| 2026-02-17 | 13F | Susquehanna Advisors Group, Inc. | 0 | -100,00 | 0 | |||||
| 2025-11-10 | 13F | MAI Capital Management | 0 | -100,00 | 0 | -100,00 | ||||
| 2026-01-22 | 13F | Addenda Capital Inc. | 183.000 | -9,84 | 9.963 | -11,29 | ||||
| 2026-02-10 | 13F | Norges Bank | 879.178 | 34.872 | ||||||
| 2026-02-10 | 13F | Bruce G. Allen Investments, LLC | 22 | 57,14 | 1 | |||||
| 2026-02-12 | 13F | BlackRock, Inc. | 124.370 | 0,15 | 4.940 | 0,04 | ||||
| 2026-01-23 | 13F | Burney Co/ | 18.695 | 0,03 | 743 | -0,13 | ||||
| 2026-01-30 | 13F | Caldwell Securities, Inc | 25 | 0,00 | 1 | |||||
| 2026-02-13 | 13F | Police & Firemen's Retirement System of New Jersey | 19.397 | 0,00 | 770 | -0,13 | ||||
| 2026-02-17 | 13F | Public Employees Retirement System Of Ohio | 82.156 | 6,32 | 3.263 | 6,15 | ||||
| 2026-02-17 | 13F | Engineers Gate Manager LP | 12.216 | -52,91 | 485 | -53,06 | ||||
| 2026-02-17 | 13F | Citadel Advisors Llc | Call | 37.200 | -67,17 | 1.478 | -67,21 | |||
| 2026-01-16 | 13F | Ronald Blue Trust, Inc. | 0 | -100,00 | 0 | |||||
| 2026-02-17 | 13F | Royal Bank Of Canada | Put | 0 | -100,00 | 0 | ||||
| 2026-02-17 | 13F | Citadel Advisors Llc | Put | 27.900 | 8,56 | 1.108 | 8,52 | |||
| 2026-01-13 | 13F | Fort Washington Investment Advisors Inc /oh/ | 35.815 | -21,83 | 1.423 | -21,91 | ||||
| 2026-02-12 | 13F | Bank Of Montreal /can/ | 1.313.615 | 10,34 | 52.104 | 10,11 | ||||
| 2026-02-17 | 13F | Optiver Holding B.V. | 5 | 0 | ||||||
| 2026-02-12 | 13F | Dimensional Fund Advisors Lp | 1.076.365 | -1,35 | 42.755 | -1,45 | ||||
| 2026-01-16 | 13F | Empirical Financial Services, LLC d.b.a. Empirical Wealth Management | 0 | -100,00 | 0 | |||||
| 2026-02-17 | 13F | Russell Investments Group, Ltd. | 40.487 | -32,18 | 1.608 | -32,31 | ||||
| 2025-11-13 | 13F | Dynamic Technology Lab Private Ltd | 0 | -100,00 | 0 | -100,00 | ||||
| 2026-02-13 | 13F | Arrowstreet Capital, Limited Partnership | 0 | -100,00 | 0 | |||||
| 2026-02-13 | 13F | Wells Fargo & Company/mn | 341 | -14,96 | 14 | -13,33 | ||||
| 2026-02-17 | 13F | Gotham Asset Management, LLC | 0 | -100,00 | 0 | |||||
| 2026-02-17 | 13F | Lazard Asset Management Llc | 65.338 | -5,63 | 2.595 | -5,70 | ||||
| 2026-02-13 | 13F | Senator Investment Group LP | 375.000 | 150,00 | 14.895 | 149,75 | ||||
| 2026-02-11 | 13F | Group One Trading, L.p. | Call | 14.300 | 853,33 | 568 | 861,02 | |||
| 2026-02-13 | 13F | Marshall Wace, Llp | 0 | -100,00 | 0 | |||||
| 2026-02-11 | 13F | Group One Trading, L.p. | Put | 1.300 | 85,71 | 52 | 88,89 | |||
| 2026-02-13 | 13F | Van Eck Associates Corp | 148.444 | 6 | ||||||
| 2026-01-30 | 13F | AMG National Trust Bank | 7.753 | 308 | ||||||
| 2025-11-14 | 13F | Axa S.a. | 0 | -100,00 | 0 | |||||
| 2026-02-13 | 13F | Great West Life Assurance Co /can/ | 6.709 | -11,65 | 0 | |||||
| 2026-02-17 | 13F | Millennium Management Llc | 271.649 | -76,53 | 10.790 | -76,55 | ||||
| 2026-02-06 | 13F | IFP Advisors, Inc | 215 | 0,00 | 9 | 0,00 | ||||
| 2026-01-30 | 13F | Exencial Wealth Advisors, Llc | 45.669 | 5,83 | 1.814 | 5,71 | ||||
| 2026-02-18 | 13F | GWM Advisors LLC | 2.000 | 0,00 | 79 | 0,00 | ||||
| 2026-02-13 | 13F | Morgan Stanley | 292.664 | -27,70 | 11.625 | -27,77 | ||||
| 2026-02-17 | 13F | Tower Research Capital LLC (TRC) | 344 | -93,52 | 14 | -93,84 | ||||
| 2026-02-05 | 13F | Northwestern Mutual Wealth Management Co | 20.196 | 44.780,00 | 2.894 | 289.300,00 | ||||
| 2025-11-14 | 13F | AXA Investment Managers S.A. | 8.723 | 347 | ||||||
| 2026-01-29 | 13F | IMC-Chicago, LLC | Call | 17.300 | 40,65 | 687 | 40,49 | |||
| 2026-02-10 | 13F | Bank of New York Mellon Corp | 1.085.710 | -21,92 | 43.124 | -22,00 | ||||
| 2025-11-14 | 13F | Trexquant Investment LP | 0 | -100,00 | 0 | |||||
| 2026-02-13 | 13F | Centiva Capital, LP | 0 | -100,00 | 0 | |||||
| 2025-11-14 | 13F | Cubist Systematic Strategies, LLC | 109.598 | -43,52 | 4.358 | -32,17 | ||||
| 2026-02-17 | 13F | Woodline Partners LP | 139.576 | 5.544 | ||||||
| 2026-02-13 | 13F | Mariner, LLC | 5.207 | 207 | ||||||
| 2026-02-10 | 13F | Evolution Wealth Management Inc. | 100 | 4 | ||||||
| 2026-02-11 | 13F | Clearbridge Investments, LLC | 79.923 | -3,43 | 3.175 | -3,53 | ||||
| 2026-02-17 | 13F | Caption Management, LLC | 10.018 | 0,00 | 398 | -0,25 | ||||
| 2026-02-13 | 13F | Citigroup Inc | 18.409 | 261,60 | 731 | 261,88 | ||||
| 2026-02-13 | 13F | Ubs Asset Management Americas Inc | 162 | 6 | ||||||
| 2026-02-17 | 13F | Susquehanna International Group, Llp | 72.506 | 82,83 | 2.880 | 82,68 | ||||
| 2026-02-10 | 13F | CIBC World Markets Inc. | 19.211 | -24,48 | 762 | -24,63 | ||||
| 2026-01-26 | 13F | Main Street Group, LTD | 0 | -100,00 | 0 | |||||
| 2026-02-17 | 13F | Susquehanna International Group, Llp | Put | 5.800 | -9,38 | 230 | -9,45 | |||
| 2026-02-17 | 13F | Susquehanna International Group, Llp | Call | 5.900 | -82,39 | 234 | -82,42 | |||
| 2026-02-12 | 13F | Nuveen, LLC | 43.709 | -13,38 | 1.736 | -13,51 | ||||
| 2025-11-14 | 13F | Balyasny Asset Management Llc | 0 | -100,00 | 0 | -100,00 | ||||
| 2026-02-17 | 13F | Schonfeld Strategic Advisors LLC | 0 | -100,00 | 0 | |||||
| 2026-02-13 | 13F | Beutel, Goodman & Co Ltd. | 95 | 0,00 | 0 | |||||
| 2026-02-17 | 13F | Orion Resource Partners LP | 126.323 | 157,63 | 5.011 | 157,19 | ||||
| 2026-01-27 | 13F | TD Waterhouse Canada Inc. | 10.788 | 41,84 | 428 | 43,29 | ||||
| 2026-02-12 | 13F | Burke & Herbert Bank & Trust Co | 7.000 | 0,00 | 278 | 0,00 | ||||
| 2025-10-07 | 13F | Thurston, Springer, Miller, Herd & Titak, Inc. | 0 | -100,00 | 0 | |||||
| 2026-02-13 | 13F | National Bank Of Canada /fi/ | Put | 106 | 562,50 | 420 | 566,67 | |||
| 2026-01-30 | 13F | Us Bancorp \de\ | 13.877 | 0,12 | 551 | 0,00 | ||||
| 2026-02-12 | 13F | M&G Plc | 12.756.931 | 0,00 | 510.277 | 0,00 | ||||
| 2026-02-09 | 13F | Legal & General Group Plc | 47.194 | -19,36 | 1.874 | -19,47 | ||||
| 2026-02-13 | 13F | National Bank Of Canada /fi/ | Call | 265 | 38,02 | 1.051 | 37,61 | |||
| 2025-11-14 | 13F | Aperture Investors, LLC | 0 | -100,00 | 0 | |||||
| 2026-02-13 | 13F | Headlands Technologies LLC | 25.664 | 5,86 | 1.019 | 5,82 | ||||
| 2026-01-23 | 13F | Westbourne Investment Advisors, Inc. | 132.810 | -0,01 | 5.275 | -0,11 | ||||
| 2026-02-17 | 13F | PDT Partners, LLC | 0 | -100,00 | 0 | |||||
| 2025-11-14 | 13F | ExodusPoint Capital Management, LP | 0 | -100,00 | 0 | -100,00 | ||||
| 2026-02-02 | 13F | Truist Financial Corp | 6.258 | -2,11 | 249 | -2,36 | ||||
| 2026-02-10 | 13F | Goldman Sachs Group Inc | 84.012 | -89,16 | 3.337 | -89,18 | ||||
| 2026-02-17 | 13F | Laird Norton Trust Company, Llc | 7.217 | 287 | ||||||
| 2026-02-17 | 13F | Royal Bank Of Canada | 1.404.910 | -15,48 | 55.803 | -15,56 | ||||
| 2026-02-13 | 13F | National Bank Of Canada /fi/ | 311.701 | 294,43 | 12.352 | 296,28 | ||||
| 2026-02-17 | 13F | Cyrus Capital Partners, L.p. | 164.000 | 0,00 | 6.514 | -0,09 | ||||
| 2026-02-17 | 13F | Canada Pension Plan Investment Board | 190.000 | 0,00 | 7.536 | -0,21 | ||||
| 2026-02-17 | 13F | FIL Ltd | 1.803.108 | 40,33 | 71.520 | 40,00 | ||||
| 2025-11-13 | 13F | Quadrature Capital Ltd | 0 | -100,00 | 0 | |||||
| 2026-02-17 | 13F | Investment Management Corp of Ontario | 8.157 | 324 | ||||||
| 2025-11-14 | 13F | Peak6 Llc | 0 | -100,00 | 0 | -100,00 | ||||
| 2025-11-14 | 13F | XTX Topco Ltd | 0 | -100,00 | 0 | -100,00 | ||||
| 2026-02-17 | 13F | Toronto Dominion Bank | 55.872 | 11,34 | 2.216 | 10,74 | ||||
| 2026-02-10 | 13F | Semanteon Capital Management, LP | 0 | -100,00 | 0 | |||||
| 2026-02-12 | 13F | New York State Common Retirement Fund | 53.017 | 0,00 | 2.106 | -0,09 | ||||
| 2025-10-28 | 13F | BRYN MAWR TRUST Co | 956 | 0,00 | 38 | 22,58 | ||||
| 2026-02-11 | 13F | Picton Mahoney Asset Management | 422.784 | 16.793 | ||||||
| 2026-02-13 | 13F | Manufacturers Life Insurance Company, The | 0 | -100,00 | 0 | |||||
| 2026-02-09 | 13F | Geode Capital Management, Llc | 356.382 | 15,12 | 17.791 | 14,67 | ||||
| 2026-02-19 | 13F | Invesco Ltd. | 254.573 | 8,34 | 10.112 | 8,22 | ||||
| 2026-02-17 | 13F | Lombard Odier Asset Management (USA) Corp | 21.493 | -49,43 | 854 | -49,50 | ||||
| 2026-02-10 | 13F | Bnp Paribas Arbitrage, Sa | 8.554 | -73,38 | 340 | -73,45 | ||||
| 2026-02-17 | 13F | Raymond James Financial Inc | 89.607 | -6,24 | 3.559 | -6,32 | ||||
| 2026-02-10 | 13F | PCJ Investment Counsel Ltd. | 208.630 | 77,21 | 8.279 | 76,90 | ||||
| 2025-12-29 | 13F | Swiss Life Asset Management Ltd | 0 | -100,00 | 0 | -100,00 | ||||
| 2025-11-13 | 13F | Magnetar Financial LLC | 0 | -100,00 | 0 | |||||
| 2026-02-11 | 13F | Renaissance Group Llc | 26.351 | 28,61 | 1.047 | 28,50 | ||||
| 2026-02-05 | 13F | Astoria Strategic Wealth, Inc. | 9.114 | 0,00 | 362 | 0,00 | ||||
| 2026-01-29 | 13F | UBS Group AG | Call | 33.900 | 1.347 | |||||
| 2026-01-29 | 13F | UBS Group AG | 136.148 | 49,50 | 5.408 | 49,36 | ||||
| 2026-02-03 | 13F | SBI Securities Co., Ltd. | 3.220 | -33,29 | 128 | -33,51 | ||||
| 2026-02-10 | 13F | State of Wyoming | 0 | -100,00 | 0 | |||||
| 2026-01-23 | 13F | Farther Finance Advisors, LLC | 30 | 0,00 | 1 | 0,00 | ||||
| 2026-02-17 | 13F | Jones Financial Companies Lllp | 121 | 5,22 | 5 | 0,00 | ||||
| 2026-02-11 | 13F | Franklin Resources Inc | 10.706 | 8,22 | 425 | 7,89 | ||||
| 2026-02-13 | 13F | Quarry LP | 0 | -100,00 | 0 | |||||
| 2025-11-12 | 13F | First Trust Advisors Lp | 0 | -100,00 | 0 | -100,00 | ||||
| 2026-02-13 | 13F | Boston Partners | 1.196.227 | 24,17 | 48.618 | 27,02 | ||||
| 2026-02-17 | 13F | Blackstone Group Inc | 0 | -100,00 | 0 | |||||
| 2026-02-13 | 13F | Peak6 Llc | Put | 0 | -100,00 | 0 | -100,00 | |||
| 2025-11-14 | 13F | Point72 (DIFC) Ltd | 100 | 4 | ||||||
| 2025-11-12 | 13F | Steward Partners Investment Advisory, Llc | 0 | -100,00 | 0 | |||||
| 2025-11-14 | 13F | Skopos Labs, Inc. | 0 | -100,00 | 0 | |||||
| 2026-01-29 | 13F | Vanguard Group Inc | 2.746.051 | 13,96 | 108.917 | 13,69 | ||||
| 2026-02-13 | 13F | Dymon Asia Capital (singapore) Pte. Ltd. | 0 | -100,00 | 0 | |||||
| 2026-02-13 | 13F | LGT Financial Advisors LLC | 908 | 0,00 | 36 | 0,00 | ||||
| 2026-02-10 | 13F | CIBC Asset Management Inc | 60.135 | -5,65 | 2.387 | -5,69 | ||||
| 2026-02-17 | 13F | Jump Financial, LLC | 21.571 | -33,01 | 857 | -33,12 | ||||
| 2026-02-14 | 13F | Rockefeller Capital Management L.P. | 0 | -100,00 | 0 | |||||
| 2026-02-10 | 13F | Acorn Wealth Advisors, LLC | 9.500 | 0,00 | 377 | 0,00 | ||||
| 2026-02-12 | 13F | Northwest & Ethical Investments L.P. | 27.779 | 364,30 | 1.111 | 368,78 | ||||
| 2026-02-17 | 13F | Two Sigma Advisers, Lp | 7.300 | -85,99 | 290 | -86,05 | ||||
| 2026-01-08 | 13F | Value Partners Investments Inc. | 20.815 | 4,90 | 827 | 4,82 | ||||
| 2026-02-11 | 13F | Tacita Capital Inc | 12 | 0 | ||||||
| 2026-02-13 | 13F | Walleye Trading LLC | Put | 5.400 | 5,88 | 214 | 5,94 | |||
| 2026-02-13 | 13F | Walleye Trading LLC | Call | 3.500 | 6,06 | 139 | 6,11 | |||
| 2026-02-17 | 13F | Css Llc/il | 5.650 | 224 | ||||||
| 2025-11-14 | 13F | Aigen Investment Management, Lp | 0 | -100,00 | 0 | -100,00 | ||||
| 2026-02-12 | 13F | Federation des caisses Desjardins du Quebec | 31.030 | 23,73 | 1.231 | 23,99 | ||||
| 2026-02-13 | 13F | Becker Capital Management Inc | 505.819 | -4,28 | 20.091 | -4,38 | ||||
| 2026-01-29 | 13F | Pictet Asset Management Holding SA | 9.278 | -12,66 | 368 | -12,80 | ||||
| 2026-02-11 | 13F | Zions Bancorporation, National Association /ut/ | 82 | 0,00 | 3 | 0,00 | ||||
| 2026-02-17 | 13F | Ameriprise Financial Inc | 17.548 | -14,96 | 697 | -15,00 | ||||
| 2026-02-02 | 13F | Intact Investment Management Inc. | 677.610 | 17,15 | 26.875 | 16,86 | ||||
| 2026-02-17 | 13F | Fmr Llc | 2.200.806 | -3,66 | 87.416 | -3,76 | ||||
| 2025-11-14 | 13F | Jane Street Group, Llc | 0 | -100,00 | 0 | -100,00 | ||||
| 2026-02-12 | 13F | Quadrant Capital Group Llc | 12.692 | -0,23 | 504 | -0,20 | ||||
| 2026-01-29 | 13F | IMC-Chicago, LLC | Put | 0 | -100,00 | 0 | -100,00 | |||
| 2026-02-17 | 13F | Bank Of America Corp /de/ | 225.432 | -51,92 | 8.954 | -51,97 | ||||
| 2026-02-17 | 13F | Voleon Capital Management Lp | 33.539 | -42,31 | 1.332 | -42,36 | ||||
| 2026-02-13 | 13F | Charles Schwab Investment Management Inc | 288.949 | 8,39 | 11.476 | 8,25 | ||||
| 2026-01-23 | 13F | Assetmark, Inc | 281 | 11 | ||||||
| 2026-02-13 | 13F | BRITISH COLUMBIA INVESTMENT MANAGEMENT Corp | 35.335 | -8,84 | 1.402 | -9,03 | ||||
| 2026-02-13 | 13F | Barclays Plc | 4.199 | -79,46 | 167 | -80,36 | ||||
| 2026-02-17 | 13F | Qube Research & Technologies Ltd | 74.791 | 32,51 | 2.971 | 32,35 | ||||
| 2026-01-26 | 13F | Cwm, Llc | 1.000 | 0,00 | 0 | |||||
| 2025-09-29 | NP | PXF - Invesco FTSE RAFI Developed Markets ex-U.S. ETF This fund is a listed as child fund of Invesco Ltd. and if that institution has disclosed ownership in this security, then these positions will not be double counted when calculating total shares and total value | 9.093 | 0,00 | 305 | 7,04 | ||||
| 2026-01-16 | 13F | Louisbourg Investments Inc. | 20 | 0,00 | 1 | |||||
| 2026-02-13 | 13F | SRS Capital Advisors, Inc. | 18 | -78,05 | 1 | -100,00 | ||||
| 2026-02-10 | 13F | Root Financial Partners, LLC | 5.900 | 234 | ||||||
| 2026-02-17 | 13F | Citadel Advisors Llc | 0 | -100,00 | 0 | |||||
| 2026-02-06 | 13F | Larson Financial Group LLC | 53 | 2 | ||||||
| 2026-02-10 | 13F | Scheer, Rowlett & Associates Investment Management Ltd. | 685.524 | -12,05 | 27.191 | -12,23 |